
Improve Website Performance with Page Speed Insights from Google Lighthouse
Updated: July 31, 2023
Originally Published: June 6, 2019
In November of 2018, Google announced that Lighthouse would drive PageSpeed Insights. Lighthouse, an open-source, automated tool built into Chrome Developer Tools, analyzes performance metrics from lab and field data to return a performance score and a checklist of improvement opportunities. New in 2023, PageSpeed Insights includes links that are shareable for 30 days with a timestamp denoting the time of analysis.
Faster interaction times can improve your site ROI. Lighthouse audits highlight content and/or scripts that impede end-users interaction with visible content on the webpage. As the user begins to read or interact with the visible content, additional content and scripts continue to load or run in the background.
How Do Many Websites Score?
An analysis in June 2018 of the Lighthouse performance scores of 70 leading retailers found that most of them operate slow websites. The average score was a 22.1 out of 100. B&H Photo scored 59, to top the list, while several sites scored a zero.
More recently, February 2023 statistics from Forbes.com show that 40% of users will leave a page that doesn't load in less than 2 seconds, costing retailers $2.6 billion U.S. dollars in sales each year.
How to Test Your Site
To run a test with Lighthouse, load the web page into your Chrome browser and open the Developer Tools panel with the keyboard shortcut Command+Option+I (Mac) or Control+Shift+I (Windows, Linux). Alternatively, go through the Chrome menu under More Tools, under the Audits tab, click Run Audits.
Lighthouse tests a single page at a time. For a more comprehensive look at the status of your site, run the test on multiple pages with different content types. Include key conversion pages, such as signups and shopping carts. Remember that different network conditions and external resources may cause a site’s score to vary in subsequent tests. Run Lighthouse tests from a hosted service to improve consistency.
Newer tools allow you to run bulk page speed tests against 100% of site URLs at once.
About the Results
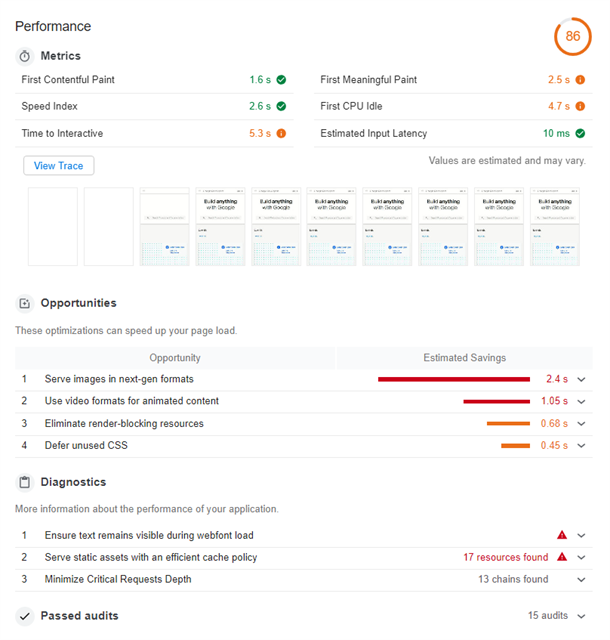
Below are the results of the developers.google.com site as audited for performance by Lighthouse against a Simulated Fast 3G connection. Don’t let the red, orange, and green color scheme mislead you -- Opportunities are not Errors. This report sheds light on ways to improve site performance. Caution: Some improvements come at the cost of significant implementation and/or maintenance effort, sometimes with little potential ROI.
Out of 100 possible points,
- Good sites score over 75;
- Average sites run 45-74;
- Poor sites range from 44 to 0.
- Only results under Metrics contribute to the score.
Audits under Opportunities and Diagnostics do not impact the overall score. See the Lighthouse Scoring Guide for more detail.
What Can You Do to Improve Site Scores?
Defer Off-Screen Images
Optimize image files and sizes as your first and most effective way to improve site speed. Next, if your site includes many or large images or videos, lazy-load assets that are not critical to the first screen view. Lazy loading allows for faster perceived load time and fewer downloads to the end-user.
Minimize Use of Third-Party Scripts and Reduce JavaScript execution time
Limit third-party scripts to those that produce significant ROI. According to the Google developers’ site, “Third-party scripts are a predominant cause of performance slowdowns and are often caused by resources outside of your control.”
Examples of third-party scripts:
- Social sharing buttons (e.g. Twitter, Facebook, G+)
- Video player embeds (e.g. YouTube, Vimeo)
- Advertising iframes
- Analytics & metrics scripts
- A/B testing scripts for experiments
- Helper libraries, such as date formatting, animation and functional libraries.
Maintain these tools and services on your site only if they add enough value to balance the performance cost. Confirm that any third-party scripts are minified and otherwise performance-optimized though use of such attributes as async, defer, preconnect and dns-prefetch.
‘Opportunities’ That are Difficult to Implement and May Not Balance Against ROI
Efficiently Encode and Size Images Properly
Warnings will alert you to unoptimized images. Again, optimizing your images is your best defense against poor site performance and long load times. However, to fully clear this “opportunity” from the audit results, the site would need to use either the <picture> element and or <img srcset>, which means storing multiple versions of an image or employing third-party image optimization services and CDNs.
- Maintaining multiple versions of every image can be challenging for content creators.
- Content creators must understand how individual images and their containers change across screen sizes and must code for appropriate image sizes.
- Third-party image optimization services add significant cost to your project.
Defer Unused CSS
Google recommends that you wait to load any assets, including the site’s visual styles, for any content that is not immediately visible on-screen “above the fold”. This is very difficult to manage when content shown “above the fold” can change with screen size. Also, if your site has dynamic and frequently-changing content, deferring unused CSS requires coding by a developer with each content change – a fact at odds with the purpose of your CMS. That said, if you have CSS that you know is always safe to deferred, it’s possible to preload these files and add them via JavaScript after the initial page render. Built-in features of Titan 6.9.5 handle this type of preloading and deferring.
Ensure Text Remains Visible During Webfont Load
Commonly used, free Google fonts do not natively support this suggestion. However, fonts can be served locally and coded to meet this suggestion. In this case, the user may see a flash of unstyled text, meaning the text will flash from the fallback font to the branded font when the latter has loaded. This flash can be unsettling for the user and might shift the layout.
Summary
Site audits can be helpful tools for exposing glaring content errors (especially unoptimized images) and by highlighting opportunities to maximize your site’s performance. But don’t get too caught up with audit scores. Your perfect score balances your users’ needs and business needs.
If you need assistance optimizing your website for improved page speed, reach out. Our expert website design and development team is here to help!
Site audits can be helpful tools for exposing glaring content errors (especially unoptimized images) and by highlighting opportunities to maximize your site’s performance. https://nwsdigital.me/3Y98Vlt @northwoods #websites #Lighthouse #pagespeed