GA4 Setup Tips
Updated: June 1, 2026 & May 20, 2022
Originally Published: Oct. 21, 2020
Google Analytics 4 (GA4) has been the only version of Google Analytics available since July 2023, when Universal Analytics (UA) was officially sunset. It has matured significantly since its early days, and it's now a robust, full-featured analytics platform – though it still rewards those who take the time to configure it properly. Updates and improvements continue to occur on a regular basis. It's still an incredibly fun time to be working with GA.
GA4 is easy to set up and offers great insights even with a plain-vanilla installation. However, as with any tool, you should take extra steps to ensure you're maximizing the GA4 setup for your website.
This guide is what I've discovered and refined over the years. I'll keep adding to this post as things change.
- Site Search Settings
- Data Retention
- Custom Insights
- Internal Traffic Filters (for IP Addresses)
- Label Your Exploration Reports
- BigQuery Integration
- Expand the Automatic Scroll Tracking
Tip 1: Check Your Site-Search Settings
GA4 will track several user interactions by default: page views, outbound links, downloaded files, scroll depth, video plays, and site search terms. Those site-search terms are a great insight into your website visitors – they're typing, into your website's search box, exactly what they're looking for. You definitely want to capture those.
Different websites use different conventions to indicate a search term. Some use the word "query" to show that; other common examples are "s" or "keyword".
To see what your website uses, go to the search bar and type in something, then look at the URL. You’ll see something like this:

If the word or letter your website uses to designate a search term is "q," "s," "search," "query," or "keyword," you're in luck. Those are all covered by the default GA4 setting.
If you have something different, like we do on the Northwoods website, you have to make an adjustment. The phrase that designates a search term on our website is “Search_Keywords”.

If you don’t have one of the default search terms, let’s walk through how to make sure your search terms are being tracked.
To do these steps, you will need “Edit” rights in your GA4 account.
1. Go into the GA 4 Admin screen and click on the “Data Streams” option.

2. Click on the right arrow on your Web property.

3. In the “Enhanced measurement” window that opens up, click on the settings gear icon then “Show advanced settings” under Site search.


4. You can see the default search term parameters that already exist (in box 1). In box 2, type in the term or letter that your website uses to designate a search term. In Northwoods’ case, that’s “Search_Keywords." Then “SAVE” your work.

5. That's it! From this point forward, any search terms entered onto the site by your users will be captured.
Tip 2: Check your "Data Retention" Settings
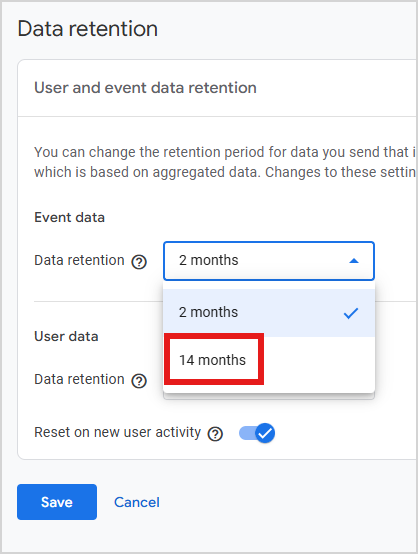
While you're in the GA4 Admin, go to "Data Retention" under Data collection and modification.
By default, the data retention is set to "2 months." This has been a consistent GA4 default – and it still trips people up.

You probably want to set that to the other option, 14 months.
There's a lot of confusion about what this setting does. It has no impact on the standard aggregated reports in the UI – you'll be able to see information in those reports going back as long as you've collected data.
The setting does affect Explorations, though. If you are building your own set of reports, you won't be able to go back more than the 2 months or 14 months you specified. So it's a good idea to choose 14 months if you want any type of meaningful time-based Explorations.
Also: Note the toggle for "Reset user data on new activity." By default, that's on, which makes sense. It just means that, regardless of which limit you choose, each time a user visits your website, the clock resets to when their data will be deleted.
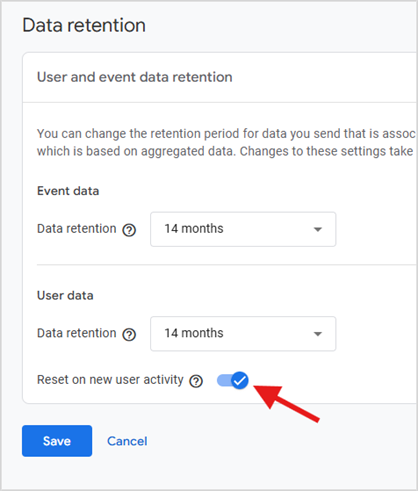
Make sure to "Save" your changes!
Tip 3: Create Custom Insights
Here’s the best tip so far – not only because some day it’ll warn you about something catastrophic happening on your website, but because it’s kind-of hidden.
GA4 relies on machine-learning (ML) insights to supplement the stripped-down UI. Got something weird happening on your site? Ideally, an insight will report on that anomaly. But there are also some custom insights you'll want to enable.
The insights are available in a couple of places, including on the home page. Go ahead and click on “View all insights”.

In the next page (home / insights), click on "Create."

You'll see a list of suggested custom insights, all of which could be important depending on your website. But one of them will be important for all websites – the "Anomaly in daily views" (1). Here's where you can set up a notification that emails you about anomalies in page views. (e.g., you had zero page views today. I bet something's broken!)
Go ahead and click on the “Review and create” link (2).

Now you have a choice of specifying exactly what you want to be notified about. I can’t tell you how happy this makes me. It’s a wonderful practice to set up notifications when things are going wrong on your website. Most people don’t do this (it’s done through custom alerts in the older version of GA), but GA4 makes it very easy to set up. So easy, in fact, that I would accept the default of “Has anomaly." I think GA4’s ML will be able to figure this out just fine. I would for sure create the “daily views” custom insight; you can decide if it makes sense for your website to also enable the other custom insights.
Even better – you can create your own custom insights from scratch.
As small as these custom insights may seem, this is one of my favorite little features of GA4. I love proactively setting up alerts and it's so easy to do here. Nicely done, GA4 team!

Specify the e-mails of the people you want notified:

When you’re all done, go ahead and press the “Create” button.
When an anomaly happens, you'll get an e-mail like this one:

At some point in the future, when that anomaly fires and you’re able to go in and resurrect your website tracking because something stupid broke – please send me an e-mail and thank me!
Tip 4: Create Filters for Internal Traffic (but don't make them live)
There are filters you can use for either internal traffic or dev/test environments. Let's walk through setting up an "internal traffic" filter.
Start in the admin section of GA and click on the “Data Streams”.

Click on the web stream for which you’ll create the filters:
Go to "Tagging Settings":

Click on "Show more", then "Define Internal Traffic":


Click on "Create":

You’ll now have your first opportunity to start adding an IP address (or multiple - up to 10 rows). Put in the name of the configuration (1), the match type (2), and the IP address (3).

There are multiple match types – and, as of recent updates, RegEx is now available as one. This was a long-standing frustration that Google finally addressed.

Here’s a sample configuration filled out for my home IP address:

IMPORTANT: Even though GA4 uses “Anonymize IP” (dropping off the last octet in the IP address), for the “IP Address equals” option, you have to use the full IP address.
Save your changes. You’ll now see that configuration show up in your list of “internal traffic” rules.

Next, go back to “GA Admin / Data Settings / Data Filters”.

Make sure the Data Filter for Internal Traffic is set up. (I think this happens by default; I don’t think you have to do anything. But check to be sure.)

Now What?
Now you wait patiently. You won’t see any results of this filter until the next day.
The next day, you can use the dimension “Test data filter name” to look for traffic that is labeled “internal” or “not set” (i.e. external). Here is an example of the filter:


And here's where you can use it in a report in the UI:

You could also use it in Explorations, as a dimension for any of the reports you build. As a simple example:
- Specify a date range which includes the internal-traffic being set up.
- If the dimension is not there, click the + button and add the…
- “Test data filter name” dimension.
- Choose an Exploration report.
- Drag or choose the “Test data filter name” to the “Rows” section.
- You’ll now see the internal traffic and the not-set traffic.

Expect changes with the internal traffic filter
Good news on this front: the RegEx match type – long the biggest frustration with GA4’s IP filtering – is now available. That removes the main barrier for large or multi-site organizations trying to define internal traffic across a range of IP addresses. The lack of traditional views still stings for anyone who built complex UA filter setups, but BigQuery and Looker Studio have largely filled that gap for advanced use cases. The near-term changes I was hoping for did arrive – just on Google’s timeline, not mine.
Make the Internal Traffic Filter Live?
I think it’s great to set up the internal traffic filter – but leave it in test mode. You can always do your analysis and exclude that segment, either in the GA4 interface or in Big Query. But since there is only one “view” in GA 4, I’m reluctant to start excluding traffic that you’ll never get back. Mess up that IP filter and the data is gone forever – there’s no raw view on which to fall back.
But if you *really* want to make the internal-traffic filter live
Here's how.
- In the GA4 Admin screen, choose Data Settings / Data Filters
- Click on the three dots on the "Internal Traffic" line.
- Activate the Filter

You'll get a warning screen. Pay attention to it. Have you really tested the internal-traffic filter? Are you sure? if so, choose "Activate filter".

You'll now see that the internal-traffic filter is active.

My strong recommendation: don't activate it. Without a raw view to fall back on, it's too risky to start excluding traffic – particularly since you can easily filter out internal traffic in the GA4 UI, in BigQuery, or in Data Studio (formerly Google Looker Studio).
Tip 5: Label Your Exploration Reports
Here’s a simple idea – make sure that every report you create in Explorations has a name.

Otherwise, once you start creating reports, you’ll be hard pressed to remember what’s in the myriad “Untitled exploration” reports.

Bonus tip: GA4 now lets you share Explorations with other users in your property. Naming them becomes even more important when colleagues are navigating your work.
Tip 6: Set up BigQuery Integration
Honestly one of the most impressive features of GA4 is its built-in integration with BigQuery (part of the Google Cloud Platform).
BigQuery integration remains one of the most important features of GA4. It's no longer a novelty – for serious analytics work, it's essentially a requirement.
You can set up automatic export of GA4 data directly into BigQuery and specify whether it runs once per day or virtually instantaneously. The "once per day" option will essentially be free (depending on how much data you have). For the "instantaneous" exports, you'll have to set up a billing account.
BigQuery is where the real GA4 analysis happens for most organizations doing anything beyond basic reporting. Once the data is in BigQuery, you have access to a whole new world of processing and analysis – and it integrates seamlessly with Data Studio, dbt, and other modern data tools.
Tip 7: Expand the Automatic Scroll Tracking
One of the enhanced measurements set up by default in GA4 is scroll tracking. It's loaded on every page and fires when the visitor gets 90% of the way down the page.
This approach is smart. It’s a nice attempt to capture meaningful data without being inundated with noise.
Sometimes, though, you'll want to track scroll depth at more than just the 90% mark – e.g., for blogs or other long-form content. Personally, I like to track those at the 25, 50, and 75% marks.
Steps to add more Scroll Tracking in GA4, Using GTM
1. In GTM, enable the "Scroll Depth Threshold" and "Scroll Depth Units" in the built-in variables section.

2. You’ll need a scroll-depth trigger. Two important notes:
- You can set the percentages to whatever you want. In this case, the percentages of 25, 50, 75, and 100% ill end up getting added to the 90% built-in GA4 scroll tracking.
- I recommend only firing the trigger on certain sections of your site (the “/blog” pages in this example).

3. Create a new tag of type “GA4 Event”.

4. With this new tag (see screenshot for steps):
- Name it however you’d like.
- Use the name of the GA4 configuration tag you’ve previously set up in GTM.
- Make sure to use “scroll” as the event name. “scroll” is the GA4-recognized event name for the scroll-depth tracking; if you use any other name, set up is going to be harder.
- Add event parameter and use “percent_scrolled” for the Parameter Name. Again, you want to be consistent with what GA4 uses for scroll events.
- Use one of the variables you configured in step 1, above - “{{Scroll Depth Threshold}}”.
- Finally, use the trigger you set up in step 2, above.

5. Save the tag and then go into GTM Preview mode.
6. You can either look at the events in GTM’s Preview tab, or in GA4’s Debug View. I’ll show the latter.
7. Go to the DebugView in GA4 (“A” in screenshot below). On your website, go to one of the pages where you set up the extra scroll tracking (e.g. the /blog pages, in my example.) Scroll down the page. You’ll see the scroll events show up in the DebugView (“B” in screenshot).

8. Click on one of the “scroll” events so you can see the parameters. You should see “percent_scrolled”, if you set it up correctly in your GTM tag, along with the value (75% in the screenshot below).

9. That’s it! You’ve now added supplementary scroll tracking in GA4 to a specific set of your pages. Nice job!
10. Assuming it’s all working right, go ahead and publish your GTM container.
If you already had scroll-depth-tracking set up in GTM for your UA implementation, it's easy to adjust to GA4. If you're setting up scroll tracking from scratch, check out Julius Fedorovicius's resources at analyticsmania.com – he's one of the best GTM/GA4 educators out there.
Bonus Tip: Review Your Data Stream Settings
This tip didn't exist in the original guide because the GA4 Admin interface has evolved significantly. Take a few minutes to review your Data Stream's Enhanced Measurement settings – especially if your GA4 property has been running since the early days.
Key things to check:
- Page views: Should be on. But verify it's not double-firing if you've also implemented pageview tracking manually via GTM.
- Scrolls: On by default (90% threshold). Pair with Tip 10 for expanded tracking.
- Outbound clicks: On by default. Check that the definition of 'outbound' matches your expectations – cross-domain traffic can behave unexpectedly.
- Site search: See Tip 3.
- Video engagement: Tracks YouTube embeds automatically. If you have non-YouTube videos, you'll need custom GTM tags.
- File downloads: On by default. Review what file types are being tracked and adjust if needed.
A clean data stream configuration is foundational. It's worth a periodic audit – not just at setup time.
Want a GA4 setup you can trust? Getting GA4 configured correctly takes more than ticking a few boxes. And bad data leads to bad decisions. If you'd rather spend your time acting on insights than troubleshooting tracking issues, Northwoods can help. Let's talk about your analytics →
GA4 is easy to set up and even a plain-vanilla installation offers great insights. However, take these extra steps to ensure you’re maximizing the GA4 setup for *your* website. #GA4 #analytics #northwoods