
10 Google Analytics Admin Tips to Improve Your Data Collection
Most new blog posts or videos about Google Analytics tend to focus on Google Analytics 4 (GA4). But there are still millions of websites running Universal Analytics (GA3).
Setting up, tuning, and optimizing those GA3 sites is still very important – lots of work to do there, based on the GA3 properties I audit. Let’s get those GA3 sites up to where they should be.
Every good GA implementation should engage the 10 settings described below, and every webmaster should know the life-saving trouble-shooting tip I will share at the end of this article.
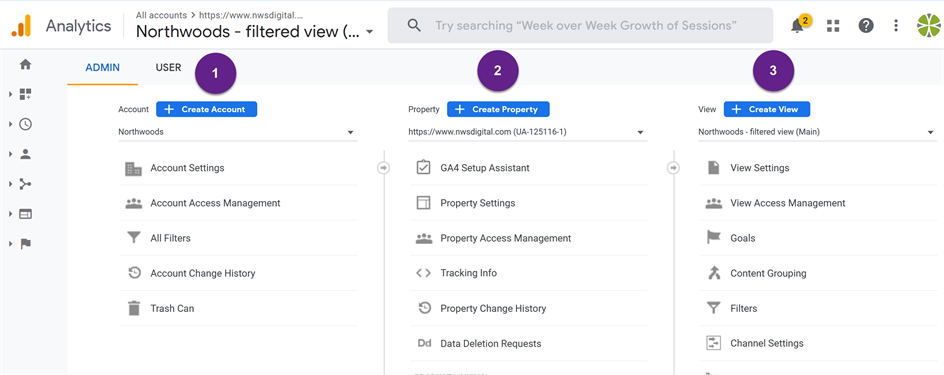
The Google Analytics 3 admin screen divides into three columns / categories.
- The Account column defines the organization – in this case, our company, Northwoods.
 tip
tip
Each Account can have up to 100 different Properties (GA3 / GA4 websites or mobile apps), and each Property can have up to 25 GA3 Views. (There are no views in GA4 properties.)
The 10 tips below affect all three categories – Account, Property, and View.
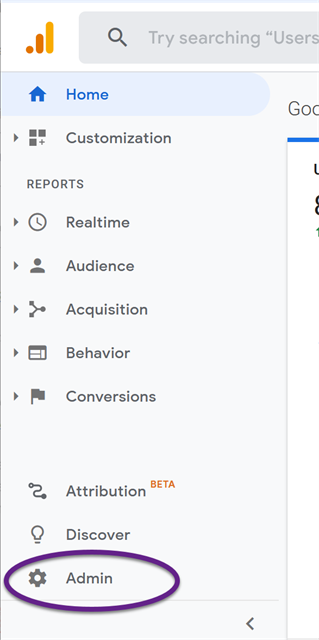
To get to the Admin screen to make these changes, click on the bottom menu item. (The appearance of the menu depends on whether you have minimized the menu.)

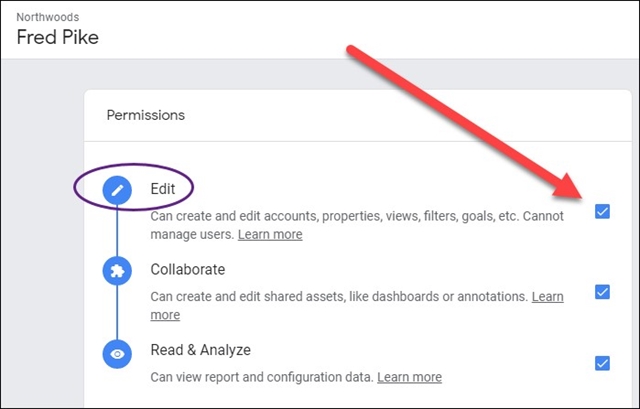
Please keep in mind: the recommended changes require admin editing rights.
Tips Quick Links
- Tip One: Set Up Multiple Views Within a Property; How to Create a New View in Google Analytics
- Tip Two: Make the Raw View a Real Safety Net
- Tip Three: Exclude Query Parameters
- Tip Four: Set Up a Hostname Filter
- Tip Five: Site Search Tracking
- Tip Six: Set Up Custom Alerts and Annotations
- Tip Seven: Set a Default View and Industry Category; Set up Benchmarking
- Tip Eight: Search Console
- Tip Nine: Referral Exclusion in Property Settings
- Tip Ten: Set Up Four Lowercase Filters
- Lifesaver Tip: Test Your Changes via Real-Time
Tip #1: Set Up Multiple Views Within a Property; Creating a New View
How to Create a New View in Google Analytics
This is not a new tip. Since about 2005, every GA influencer has touted the importance of having multiple views in your account. And yet, I audit many accounts that have just one view.
When you first set up a property, Google Analytics creates one default view – the All Web Site Data view. When I see no other view in an account, I know I’m dealing with an unsophisticated set-up.
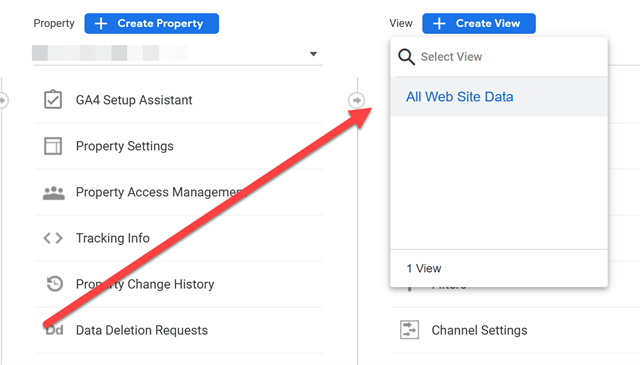
At a minimum, you should set up three (of the available 25) views:
- A filtered view, which excludes traffic from, for example, your own company and your vendors, so you see only traffic from clients or prospects.
- A test view, so you can test changes to the settings without breaking anything.
- A raw, or “unfiltered” view, which shows all traffic.
If you already have at least two of these views (the raw and filtered), feel free to skip to Tip 2. If you only have one view, proceed to Tip 1A.
Tip 1A: The Raw View
Let’s create a Google Analytics raw data view. It’s your ultimate backstop. (I’ll explain more in Tip 2 – filters.)
It’s easy to set up a new view. In the admin screen, click on +Create View.
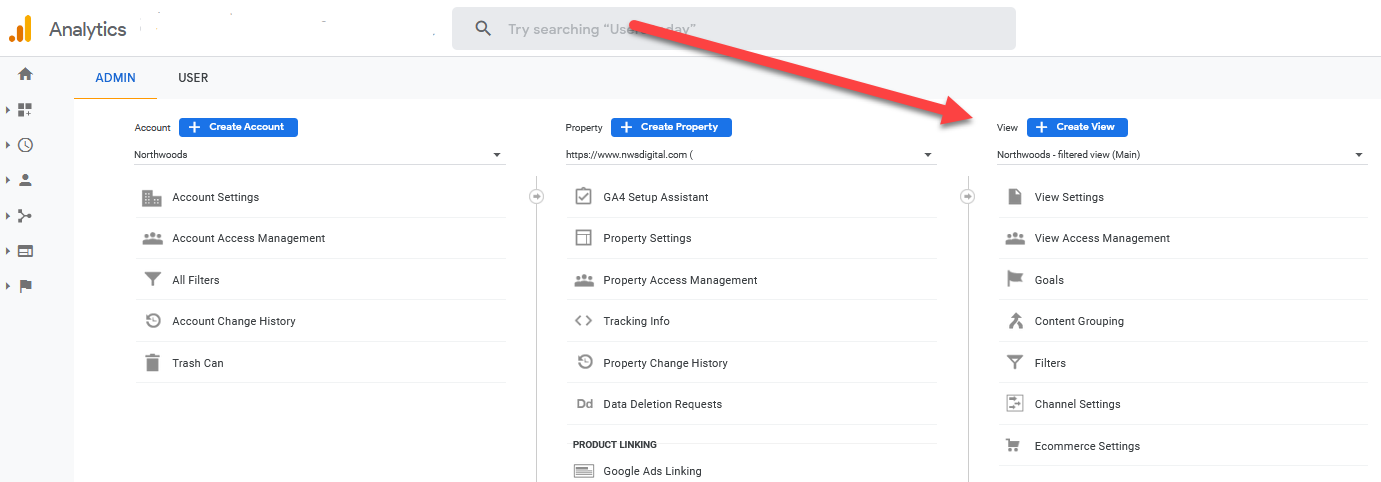
In the dialog box:
- Choose Website.
- Name it. I always specify the company name and the type of view – e.g., Northwoods – Raw (unfiltered) view.
- Set your country and time zone.
- Click on Create View.
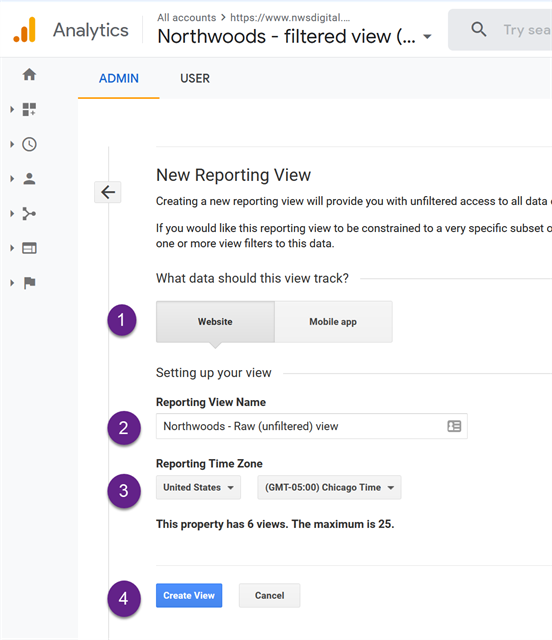
That’s it!
Congratulations, you have set up your first level of defense in case anything goes wrong with your main view.
Important: A new view activates immediately at creation point. It will not apply retroactively to existing data.
Tip 1B: The Test View
Follow the same procedure to set up a test view (more to come on when to use this).
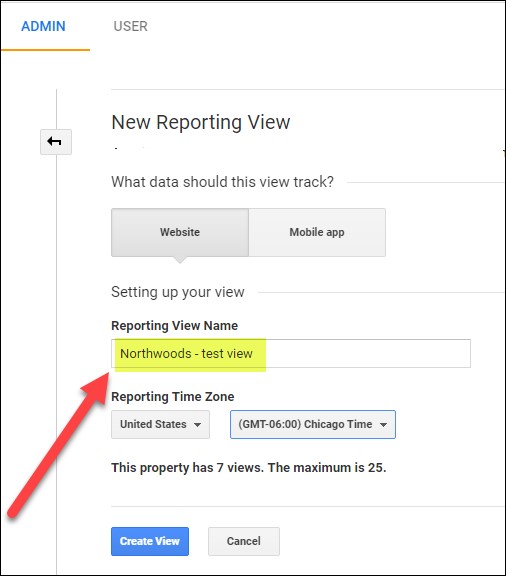
Tip 1C: The “Filtered” View
Assuming you started this process with only one view, you should now have three – the original one, a raw view, and a test view.
Make your original view, which has all your historical data, your filtered view. Think of it as your Google Analytics master view. Change the name of that view to include “filtered” or “main” in the name, as in the Northwoods example below:
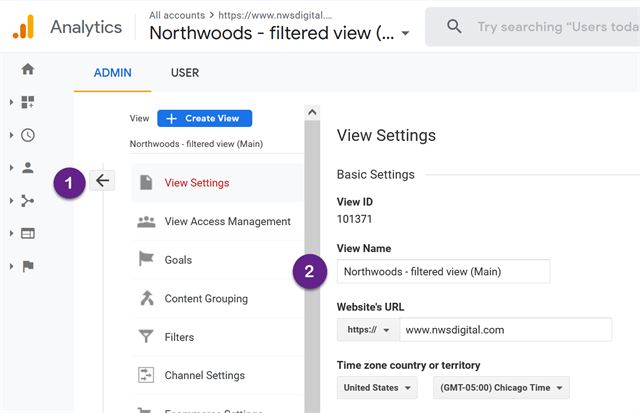
Open View Settings, change the View Name as appropriate, and save your changes.
I recommend using the company name, or at least a designation other than the default All Web Site Data. The new name should indicate what the view tracks. If you have access to multiple accounts and multiple views, a descriptive, unique name adds clarity.
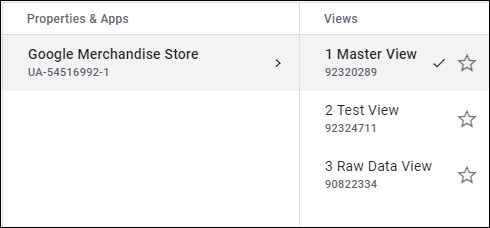
I like some combination of raw, filtered and test in my views. Any name will do, as long as it describes the function of each view. The GA account for the Google Merchandise Store, for example, uses different names than I do – but it’s clear that the set-up intention is the same.
Tip 2: Make the Raw View a Real Safety Net
Rule Number 1: Don’t change anything coming into the Raw View.
The Raw View is your safety net; it’s there in in case anything goes wrong with your main view. But if it’s to be a true safety net, it must include just about everything from your main view.
First, let’s cover what it shouldn’t include.
- The Raw View should not have any filters. None. Nada. Zilch. Filters change the data being stored in GA; you don’t want that in your safety-net view.
- Do not include any filters that block traffic, like an IP filter, hostname filter, or country-exclusion filter.
- Do not include lowercase filters like the ones we’ll set up in Tip 10, which change items like search terms or source / medium.
- While you’re at it, make sure you’re not excluding any query parameters (Tip 3).
You want all the data to show up in the Raw view. But it’s wrong to think the Raw view should be left untouched – a common mistake among even experienced GA practitioners.
Anything (other than filters) that you add to your main view you should add to the Raw view.
- If you have GSC (Google Search Console) set up in your main view (Tip 8), set it up in your Raw view.
- If you have Google Ads integrated with your main view, add it to your Raw view.
- If you have standard or enhanced ecommerce (EEC) set up on your main view, set it up on your raw view.
- If you have the Checkout Labeling (from EEC) set up in your main view, set it up on your raw view.
In short – everything you set up on the main view should also be set up on the Raw view. (Again, except filters and excluded query parameters.) Otherwise, it’s not a true backup view.
With any luck, you will never need to tap into the backup safety net of the Raw view. But if the day comes, you will have as complete and thorough a safety net as possible. When that day comes, reach out and thank me!
Tip 3: Exclude Query Parameters
When you look at the Behavior > Site Content > All Pages report, you don’t want to see something like this, where there are multiple versions of the same page:
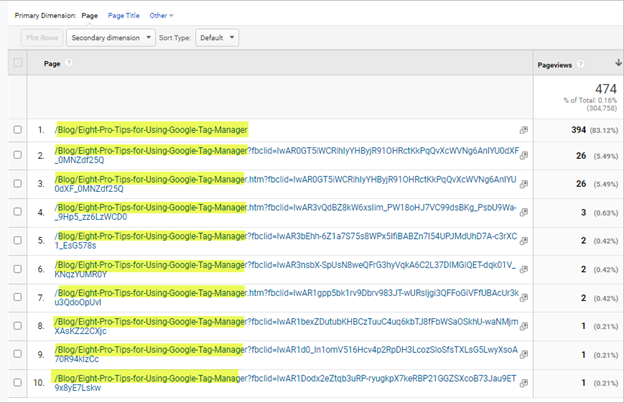
Even though the page path (URI) of each of these pages is the same, Google treats them as separate pages because of the Query Parameters – those things at the end of the page path that start with a “?”.
Query parameters can be very useful for tracking purposes, but most of the time shouldn’t be collected in GA. In the case of the screenshot, for example, all those query parameters are “fbclid” – the Facebook Click ID. That information is meaningful in Facebook, but meaningless in GA. Get rid of it – and several other similar ones to improve the tracking of your pages.
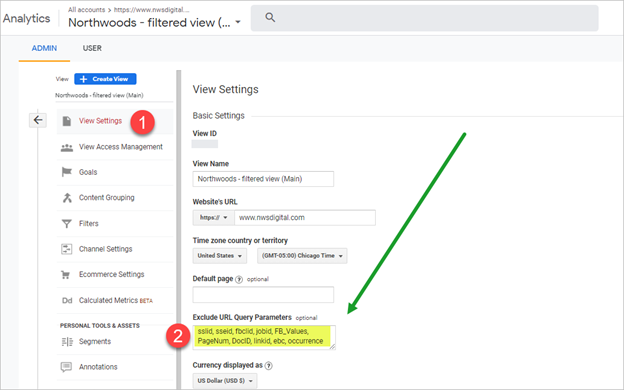
You can exclude query parameters at either the Property (through a filter) or View level; I typically do it at the view level. In your main view, go to the “Exclude URL Query Parameters” box and add in the query parameters you want to block.
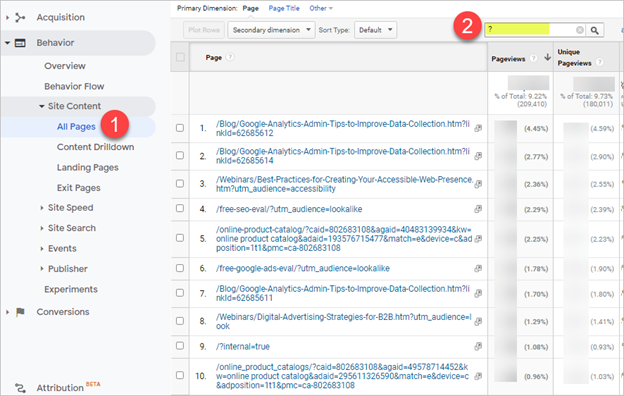
Note: to find the list of query parameters on your site, go to the Behavior > Site Content > All Pages report and type a “?” into the quick filter box. You’ll then see a list of all pages that have query parameters.
Some common query parameters that we always strip out include:
Mailchimp: mc_eid, mc_cid
Facebook: fbclid (Facebook Click ID)
Google Analytics: _ga (used for GA3 cross-domain tracking); _gl (used for GA4 cross-domain tracking)
Bing Ads: msclid (Microsoft Click ID). (Note that you may want to keep the msclid, so you know immediately where that traffic came from.)
Google Analytics, by default, will strip out all the regular UTM query parameters (utm_source, _medium, _campaign, _term, and _content) and the Google Ads identifier, gclid (Google Click ID).
In general: strip out any query parameters that are meaningless in your GA3 implementation; keep any that are meaningful.
And, as covered in Tip 2, do not exclude any query parameters from your raw view.
Tip 4: Set Up a Hostname Filter
A hostname filter serves two purposes:
- Blocking fake (spam) traffic from being sent to your site via the Measurement Protocol.
- Blocking traffic from your development, UAT (user-acceptance testing) or other testing-type sites from showing up in your main analytics.
The first one – spam – is less of an issue than it used to be.
The second one can be an issue in a semi-complex environment. For example, in this screenshot of one month’s activity, there are over 20 different legitimate hostnames shown:
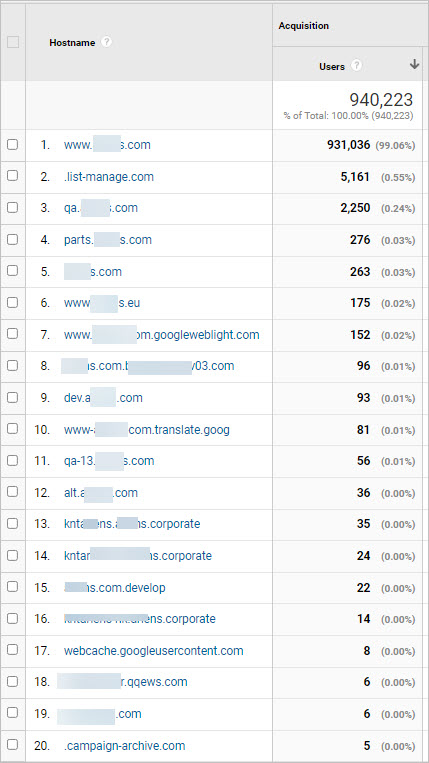
In fact, only the first one reflects the “real” live site – the one which you actually want to use to measure user activity and interactions.
Determining Your Hostnames
The key is to figure out which hostnames are legitimate for your site – which ones are running your Google Analytics property ID. If you run just one website, you can probably figure out your hostname! But your best option is always to look at a wide date range to verify the hostname(s).
In the GA view which goes furthest back in time, set your date range for a year or so, then:
- Go to Audience / Technology / Network.
- Change the dimension to Hostname.
- Verify that Hostname is indeed the dimension column name.
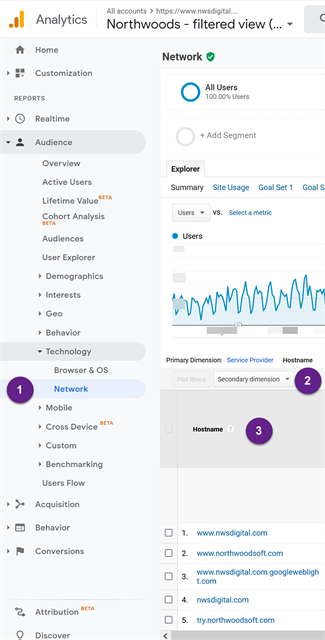
Now you’ll see the hostnames that have been reported back to Google. In this case, they’re all either our main domain (www.nwsdigital.com) or subdomains (try.northwoodsoft.com). Those are all legitimate hostnames, which we control and on which our GA Property ID runs.
Setting up RegEx of Your Hostnames
Let’s assume that my hostnames show the following legitimate entries:
- Nwsdigital.com and all the subdomains and variations
- Pages.services – the landing pages created in our marketing automation tool, Sharpspring.
I’ll want to set up a filter that allows those two hostnames. To do that, I’ll use RegEx (Regular Expressions) to define them. I won’t go into a RegEx tutorial – tons are available – but I’ll give you an idea of what it will look like.
Here’s the filter I’ll use:
^(.*\.)?northwoodsoft\.com|pages\.services$
Broken down:
- ^ starts the expression I’m going to evaluate
- (.*\.)? – this is what will allow any or no subdomain or www to be recognized.
- nwsdigital\.com – the first legitimate hostname (the “\.” just means treat the period as a period, not as a regex character)
- | “or”
- pages\.services – the second legitimate hostname
- $ End of the expression
RegEx can be confusing. The good news is that almost any developer can help you set up a RegEx string.
Setting Up the Hostnames Filter
Now that we know what the string is, we will use it to create a filter in a test view.
- Go to the test view.
- Click on Filters.
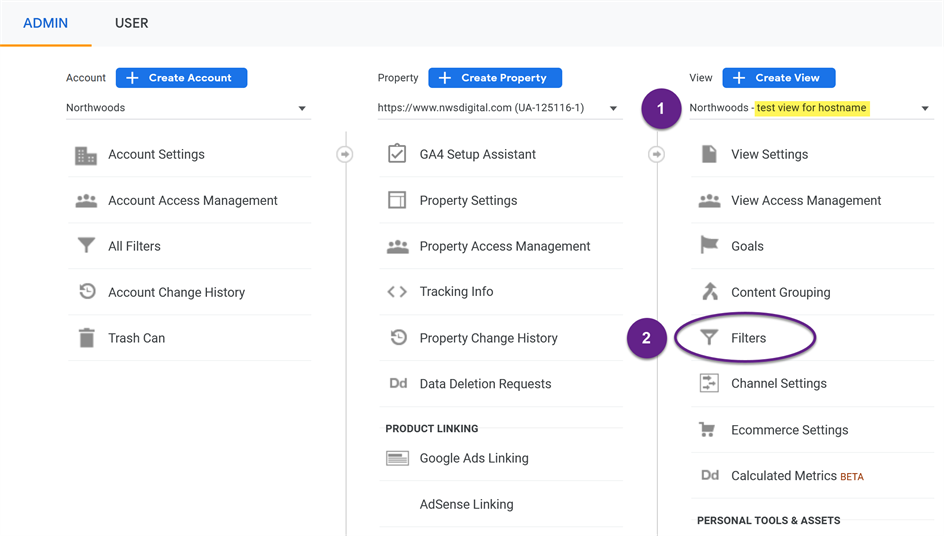
- Click on +Add Filter
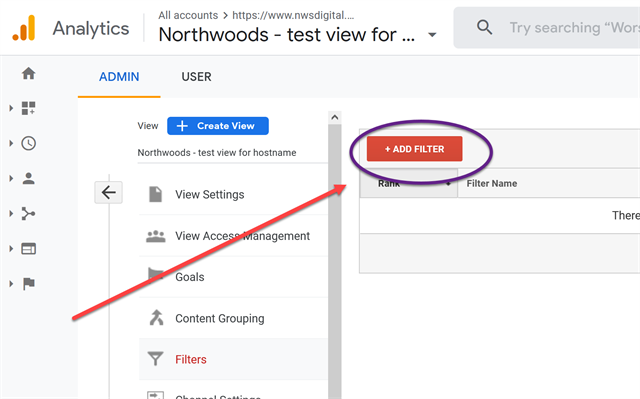
Start building your filter.
- Choose Create New Filter.
- Give it a meaningful name.
- Choose a Custom filter type.
- Click on Include. (Hint: Do NOT click on Exclude. You most definitely want Include.)
- From the dropdown list, choose Hostname.
- Enter your awesome RegEx string, from above.
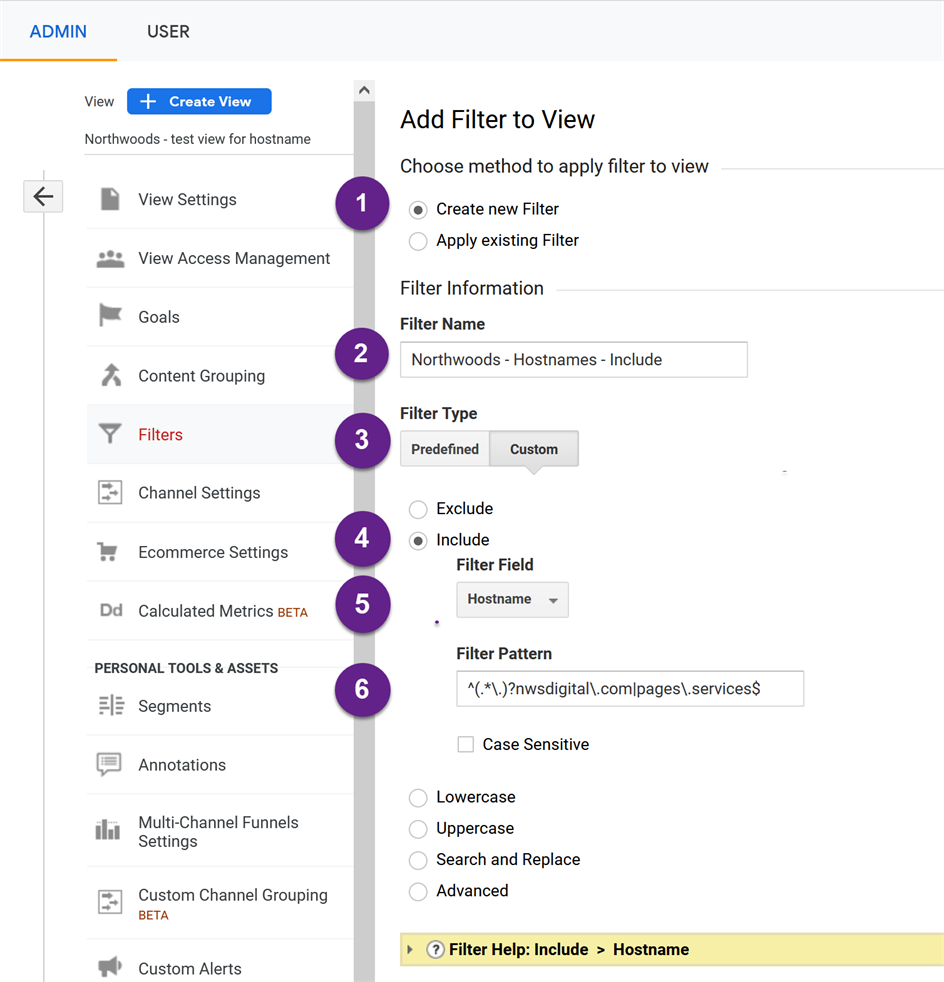
Moving down the page, you’ll see an option to Verify this filter. If you have just set up the view, this option won’t work, because the newly created view doesn’t show data retroactively; it works from the time of creation onward. Go ahead and save the filter.

After a week or so, compare this test view with your main view. Look at the Audience / Technology / Network report and change the dimension to Hostname, as we did before. The traffic metrics could differ, because you might have other filters running in your main view. But the hostnames should be the same. Your main view may have other hostnames, which could be ones you missed or could be spam hostnames. Adjust and test your filter as necessary.
Once you are confident your filter is correct, apply it to your main (filtered) view.
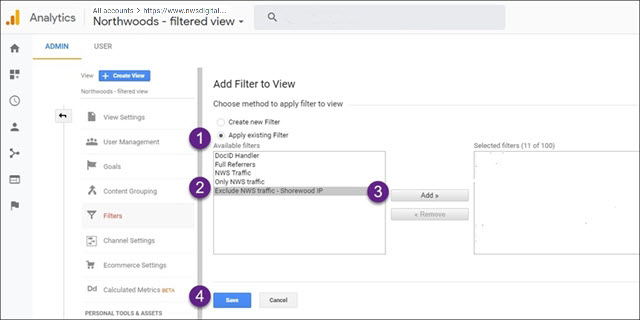
In filtered view, click on Filters and +Add Filters, as you did before. Then:
- Apply Existing Filter
- Highlight the filter you created.
- Press Add.
- Save your changes.
Tip 5: Site Search Tracking
Here’s a no-brainer: Capture the search terms visitors enter on your site. What are they looking for? This can tell you a lot about your visitors.
In the first step, enter a search query on your site and note the URL, specifically whatever precedes the search term you just typed.
Let’s say I searched for “GA admin” on the Northwoods site. If I look at the URL, I can see that my search query is defined by “Search_Keywords” (everything between the “?” and the “=”).

Or say I’m looking for alpaca on Patagonia.com – “q” defines their search query, as it does on lots of sites.

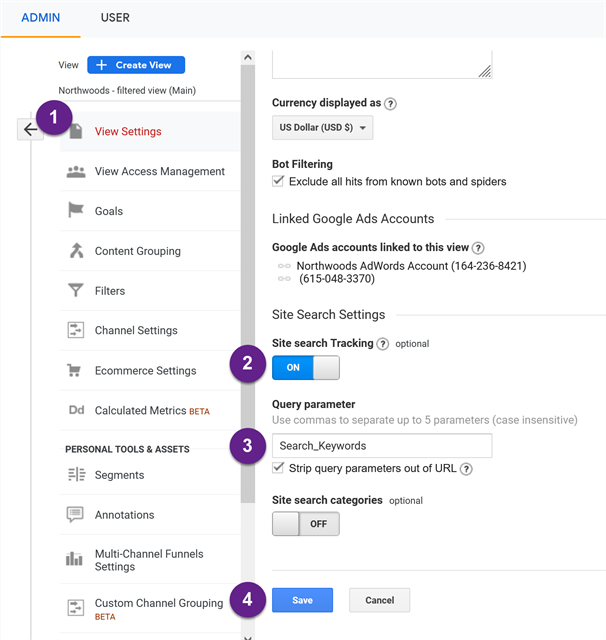
In the second step, go to Google Analytics site search within the admin panel and enter the search query parameter:
- Go to View Settings.
- Scroll down to Site search Tracking and make sure it’s On.
- Enter whatever defines your search queries.
- As shown above, this would be Search_Keywords in Northwoods’ case; “q” in Patagonia’s case
- Save your changes.
For the third and final step, go into the Behavior / Site Search / Search Terms report to see the terms users entered. Wait a few days before you do this; again, this change is not retroactive.
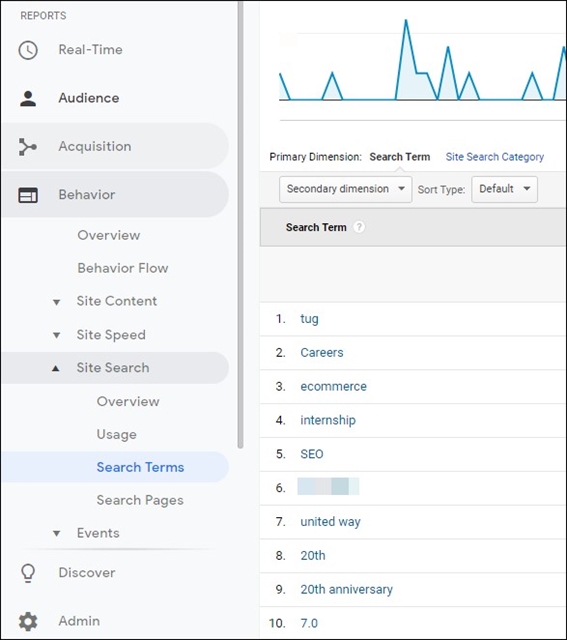
Pretty cool – you can see exactly what your visitors seek on your website. You can gain great insight from that.
In Tip 10, I’ll show you a further refinement: capturing all the search terms in lowercase, so the same search terms always show up together.
Tip 6: Set Up a Custom Alert
I recently noticed a crack in the screen protector on my iPhone. When I peeled it off to install the new one, I found six other scratches.
Holy cow! For a year, it had been protecting my phone and I wasn’t even aware of it. Not bad for a $9 add-on.

A Google custom alert is like that screen protector – when something goes wrong, it can save you. Let’s look at two recommended custom alerts.
“No Traffic” Custom Alert
The “no traffic” custom alert will let you know when your site has little or no traffic. Usually, that means something is broken – not good!
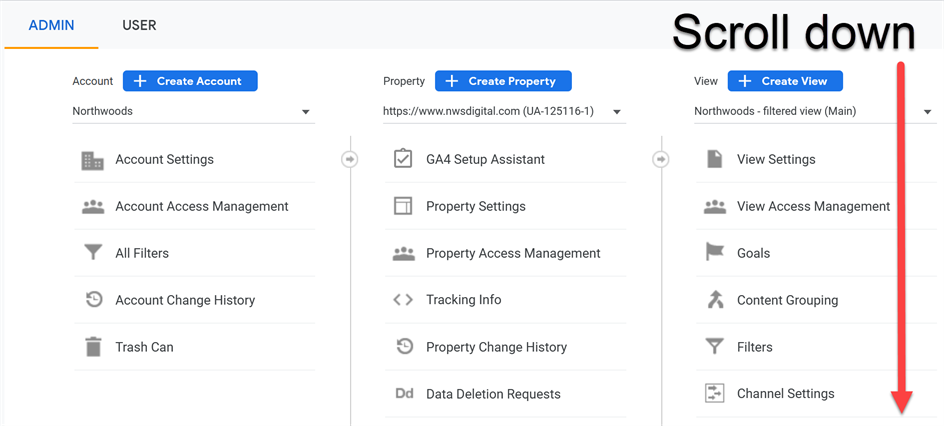
To create your no-traffic alert, go to the View column of the admin section. Scroll down to Custom Alerts.
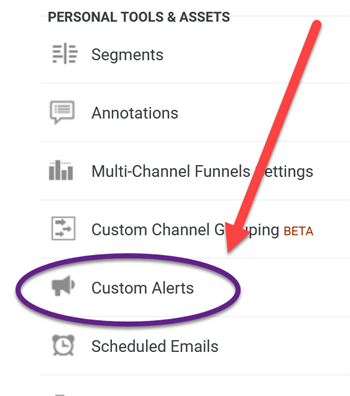
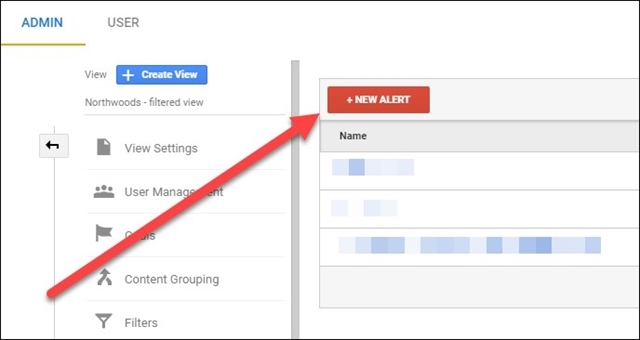
Click on Custom Alerts and then +New Alert.
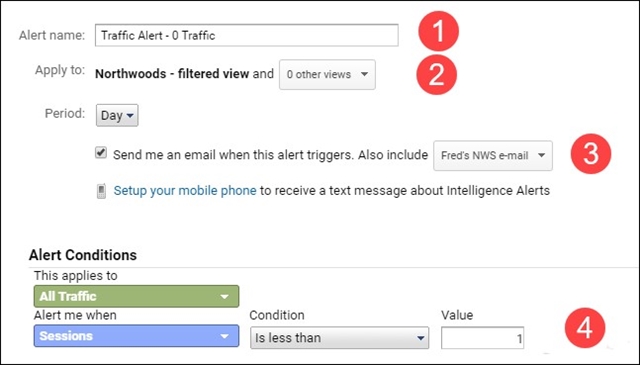
Specify the following:
- The name of the alert.
- What view this alert will apply to. At a minimum, apply it to your filtered view -- where things are most likely to break -- as opposed to your raw view.
- The email(s) to which the alert should be sent.
- Create the conditions – e.g., sessions less than 1. If you typically have 5,000 sessions on your site, I might set the alert at anything below 500 – something that represents a drastic drop in traffic.
When the alert fires, you’ll receive an email like the one below. In this case, I’ve set up an alert for a client whose websites haven’t yet launched.
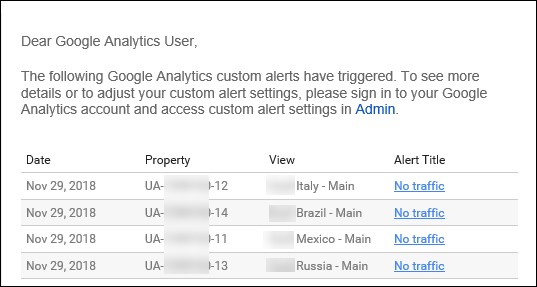
This alert won’t fix the problem causing the traffic drop. It just tells you about it within a day, and that’s a huge weight lifted.
“Low Bounce Rate” Custom Alert
Bounce rate is a meaningless metric – it didn’t even make the transition to GA4. However, a low bounce rate can be a warning signal.
As a reminder, a visitor “bounces” when they:
- visit one page on your site and then leave
- - - AND - -
- there are no “interaction” events (explained below)
An artificially low bounce rate is often caused by one of two factors.
1. “Non-interaction Hit”
When you use GTM (Google Tag Manager) to create a GA event, you have to specify whether that event is a “non-interaction hit”; the default is “false” – i.e. it is an interaction.
For example, let’s say you set up scroll tracking and kept the default of “false”. That means that as soon as somebody scrolls your page, it will count as an interaction, hence it will never be a bounce. Even if they visited just that one page and then left; it’s not a bounce because there was an “interaction”.
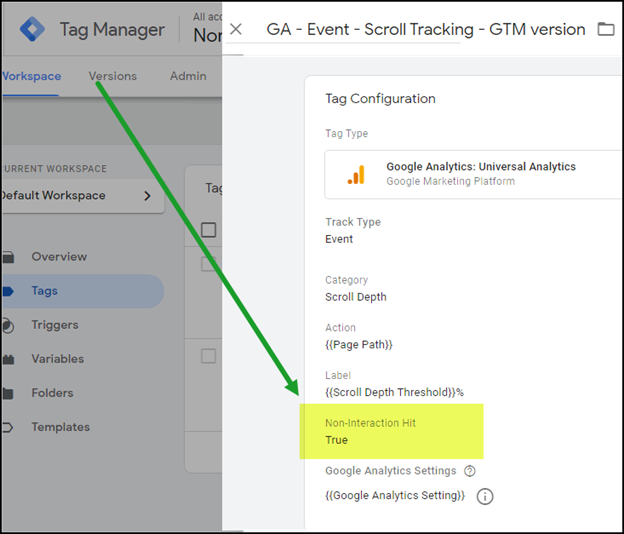
This is a sloppy set up in GTM, but the effect is not critical.
2. Duplicate Page Views
By contrast, a duplicate page view is critical. This might happen, for example, when you have GTM installed on the site and the GA code snippet is also installed. The net effect: every page visit counts as two. This will seriously mess up your analytics tracking and give you a very low bounce rate.
In short, you will want to create a custom alert for a low bounce rate and then investigate which of these two options is most likely causing the issue.
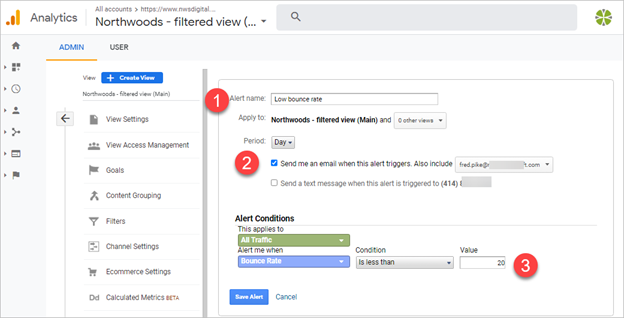
In the View column for your main view, scroll down to “Custom Alerts”.
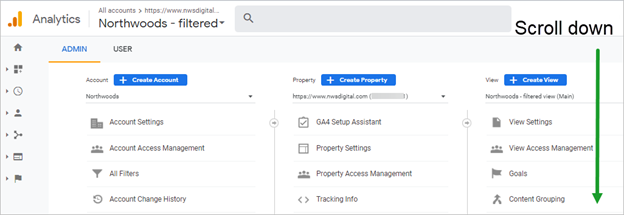
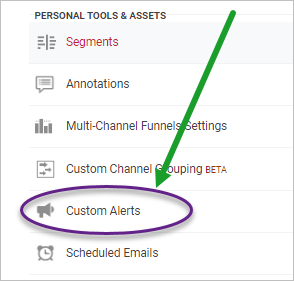
Create a new custom alert, with the following settings:
- Give it a name of “Low bounce rate”, or similar.
- Set it up for a daily e-mail to yourself and/or other team members.
- You can also send a text to yourself, but I don’t think that’s necessary.
- Set the alert based on:
- All traffic
- Bounce rate less than
- 20. This is key. Even though it’s reporting on a percentage, use a whole number – e.g. “20”, not “.20”. You can also set it a bit lower if you want, at 15 or even 10, but for me any bounce rate below 20% is suspect. So I use 20!
One note of caution: The custom alerts will only work if they’re rare. If you set the values too high and you start getting alerts every day, you’ll ignore them. So, set the values for both the number of sessions and the bounce rate at an appropriately rare level for your environment
Tip 6b: Annotations
This tip will not affect the quality of your Google Analytics data. It simply reminds you of important changes made to your website. Always make a note of any significant change that could affect your data.
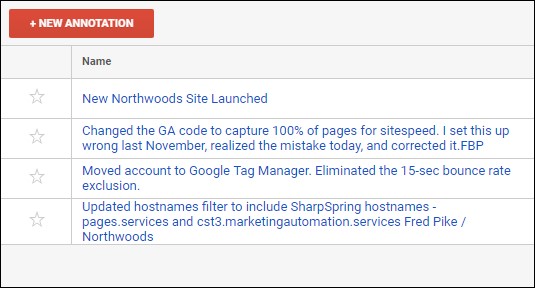
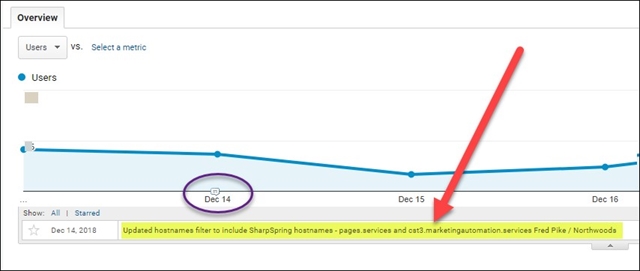
Those annotations will show up when you’re looking at any of the date charts.
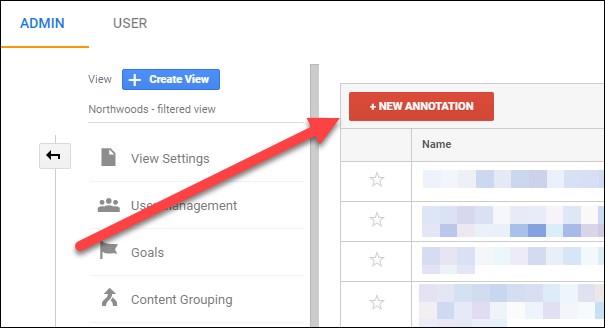
Creating an annotation is easy. Click on the Annotations link, then on +New Annotation.
On the next screen:
- Specify the date of the change.
- Describe the change (up to 160 characters).
- Specify:
- Shared – anybody who can view the GA data can see the annotation
- Private – only you can see the annotation
- Create it.
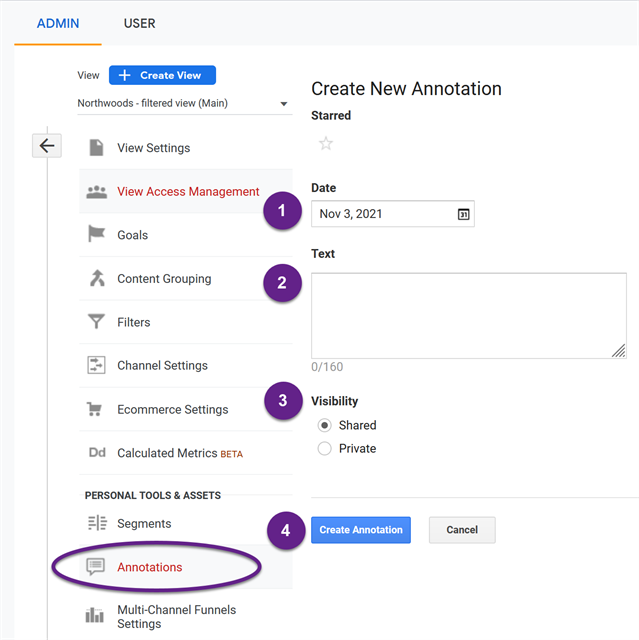
NOTE: Annotations are specific to a view. If you create an annotation in your filtered view, it won’t show up in other views.
Bonus tip: When I see annotations in a GA account, I know I’m likely dealing with a well-set-up account and a smart client.
Tip 7: Set the Default View and Industry Category; Set up Benchmarking
Now we’ll make some changes in the Property and Account columns, starting with Property Settings.

Click on Property Settings.
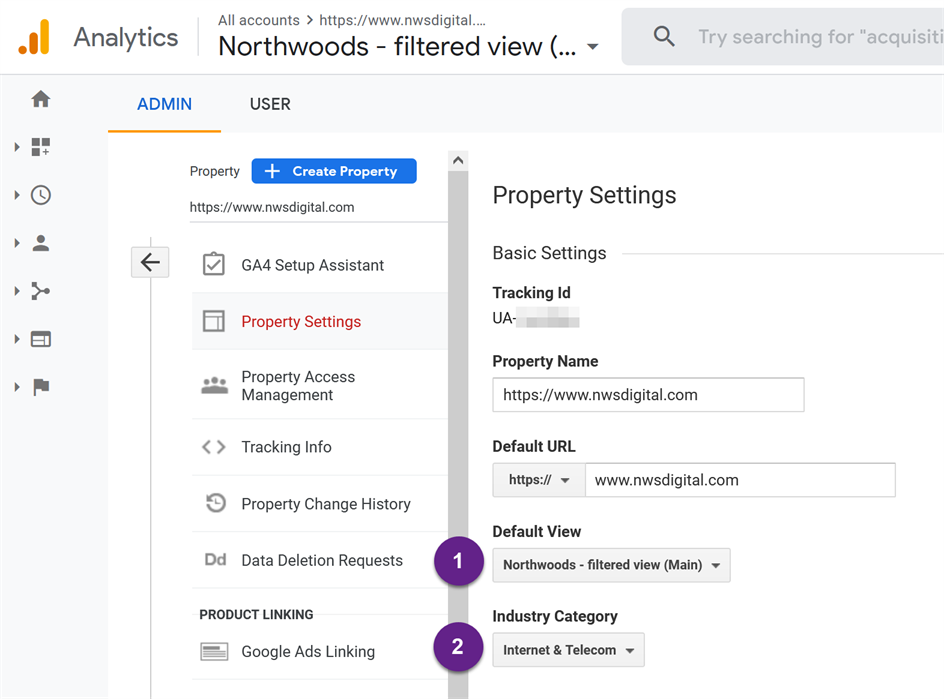
- Specify the Google Analytics Default Views. In almost all cases, this will be your filtered or main view. Set this up so that each time you go into the GA interface for your property, it will default to this view. This tiny time saver will make your life easier.
- Set the Industry Category. This will be used for the benchmarking report (below).
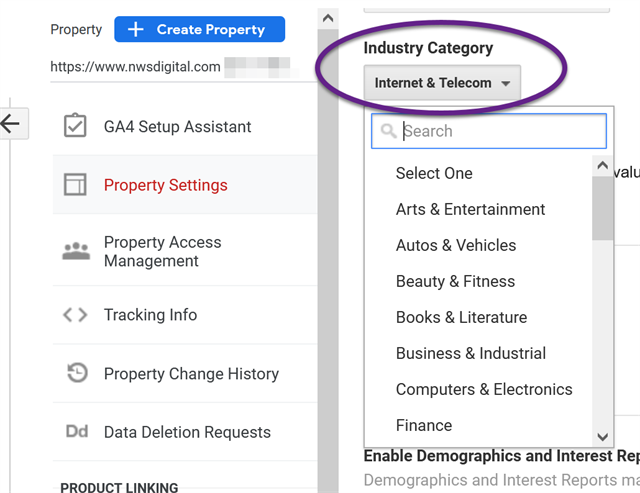
Note that when you click on Industry Category, you’ll see the Google Analytics industry category list, with 26 options. Pick the one closest to your organization.
Now, go back to the Account Settings column.
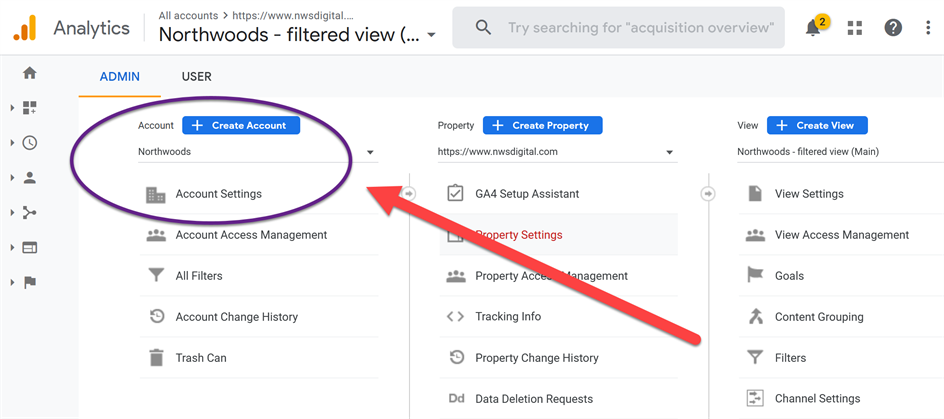
Click on Account Settings. You’ll see some information about the account and some checkboxes. At minimum, make sure the Benchmarking option is clicked. (As you can see, I’ve clicked some other boxes, too.)
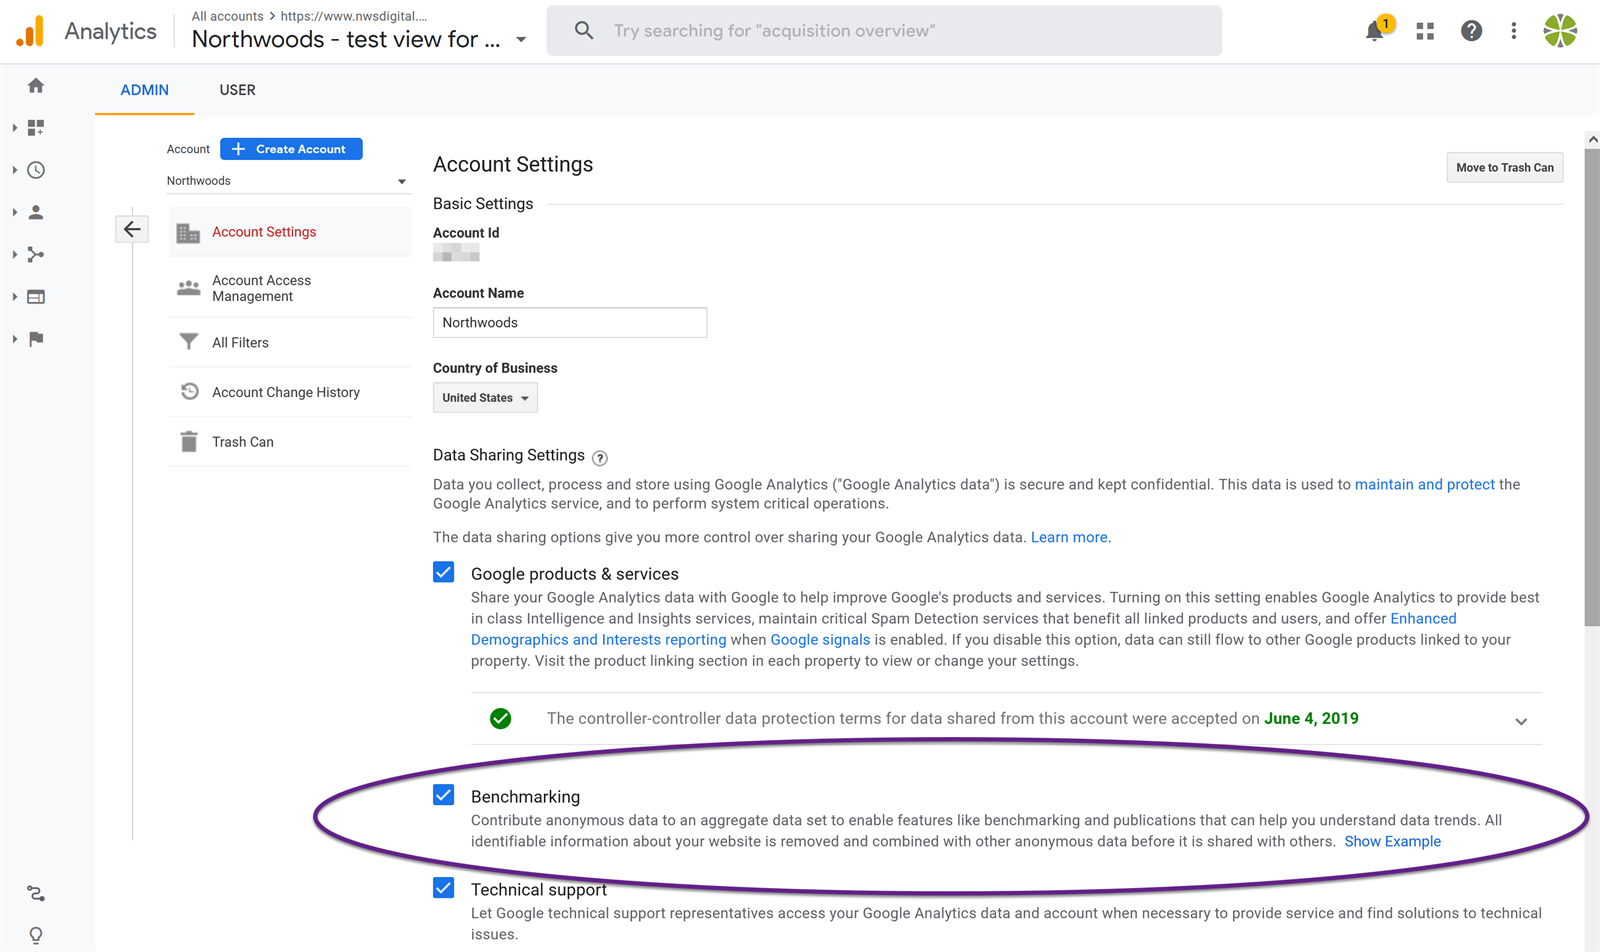
If you have both checked Benchmarking and defined the type of organization you are (Tip 7), you will be able to compare your account to thousands of other Google Analytics accounts similar to yours in traffic and organization type.
For example, we can compare our traffic to others in the Internet & Telecom field. I can see that relative to our benchmark group, Northwoods gets more traffic than peers from Organic, Direct, and Display, but less from Referral and Social.
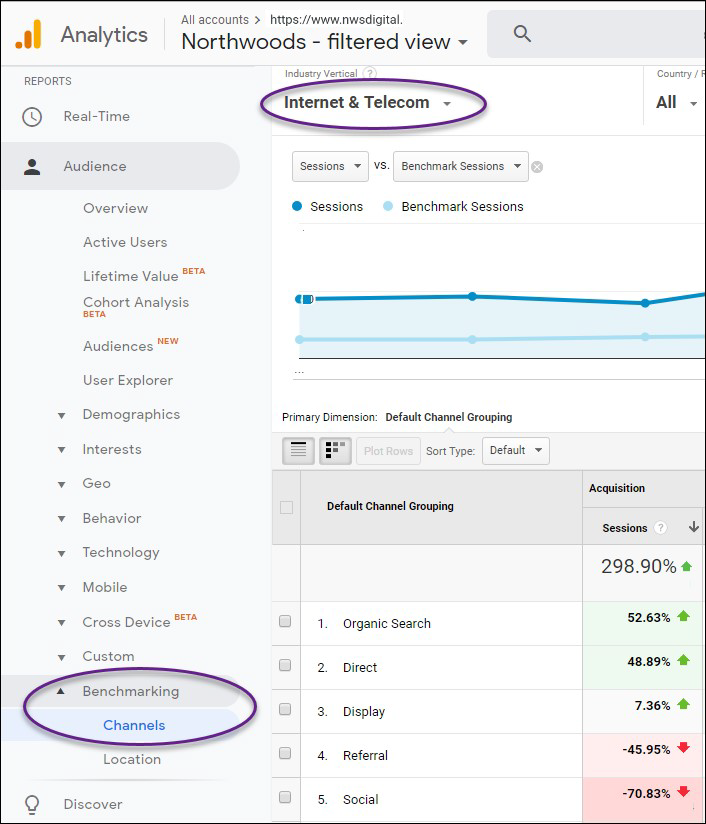
Information in the Google Analytics benchmarking report can be revelatory, and this report is one of the few ways you can compare your account to peer organizations. It’s a nice report – and under-utilized. Put Big Data to work for you!
Tip 8: Search Console
Google Search Console is another key component of a well-set-up Google Analytics account. GA informs you about the visitors to your website; Search Console informs you of the health of your website. You can import some of that data into your analytics account by linking the two.
Before you can import the data, of course, you must set up a Search Console account. Then proceed to connecting Search Console to analytics.
The Search Console information is found in the Acquisition / Search Console reports. If you haven’t set up Search Console, you’ll see an error message:
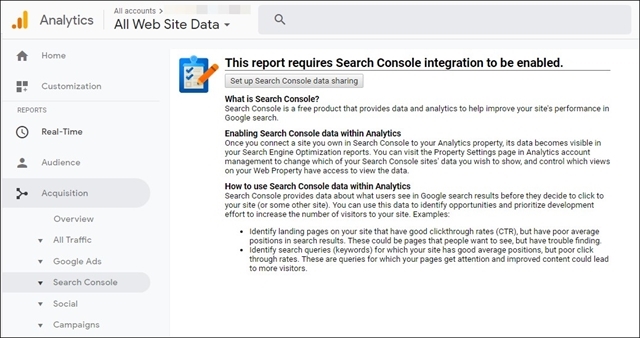
Yuck. Let’s get rid of that error screen.
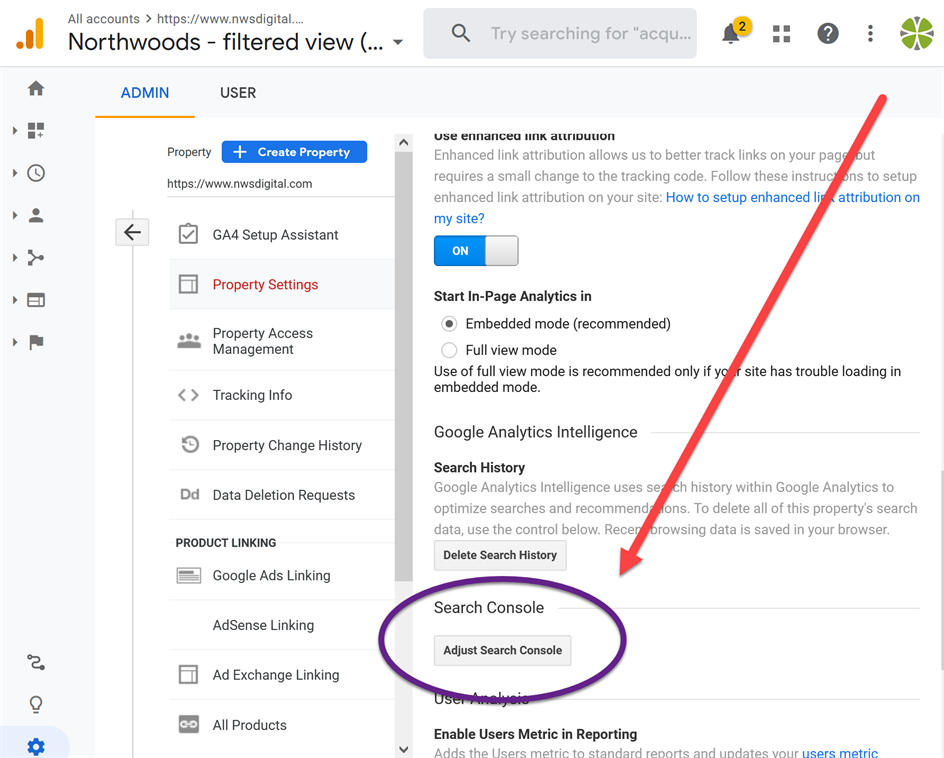
To connect Search Console to your site, click on Property Settings in GA admin.
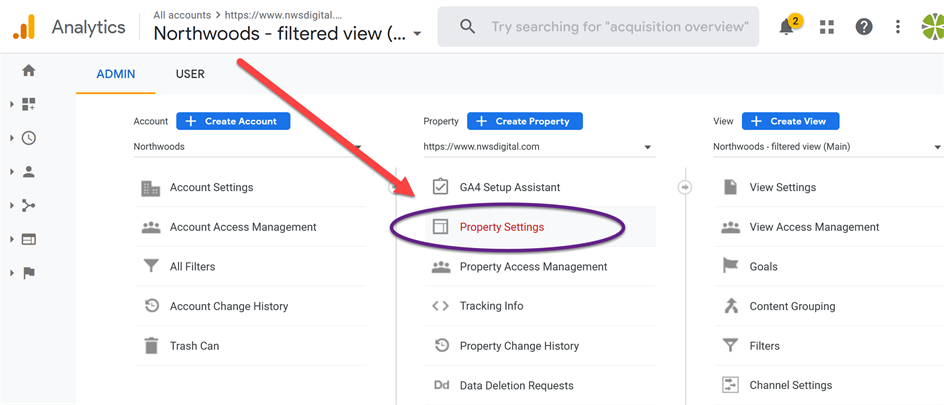
Scroll down to the Search Console section, toward the bottom of the page. Click on Adjust Search Console.
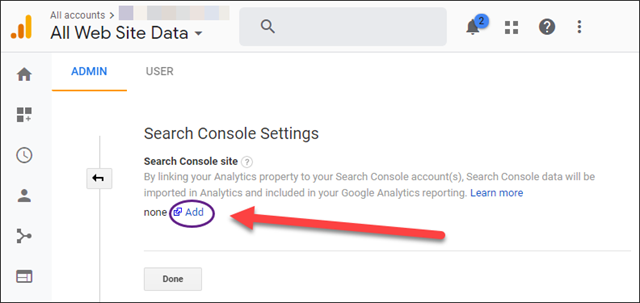
In the next screen, click on the Add option.
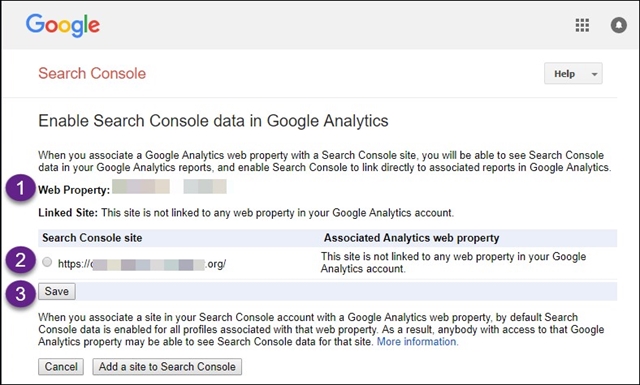
Assuming you’ve set up a Search Console account through the same Gmail account you use for your Google Analytics account, you’ll see:
- The web property to which you will link Search Console.
- One or more Search Console sites available to be linked. Choose the correct one for this analytics account.
- Save your changes.
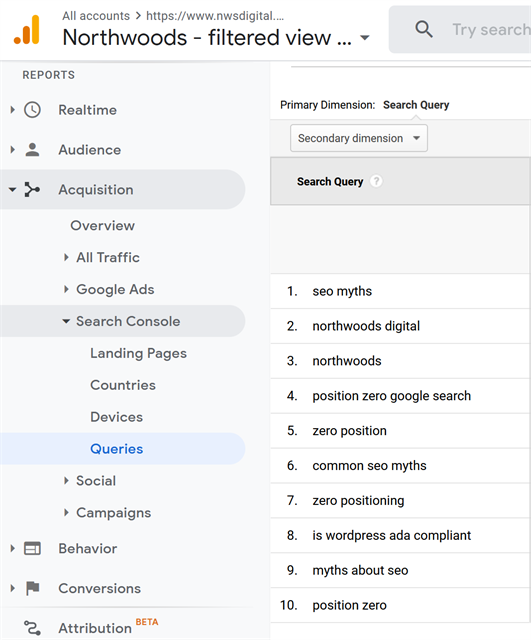
Once you have Search Console linked to your GA account, return to the Google Analytics interface. That ugly error screen should be gone. Instead, you’ll see some information from Search Console. This includes the queries or searches that prompted Google to display your website – great information to have!
Also, make sure to explore the Google Search Console for your site. The Google team continues to add more and better info to search console – things like your Core Web Vitals – and you should be looking in there regularly!
Tip 9: Referral Exclusion in Property Settings
In Google Analytics terms, a referral happens when somebody is on one website and clicks on a link that leads them to your website – the traffic is referred from the original website to yours. Referrals are a key component of a good SEO strategy, so make sure your referrals are accurate.
You don’t want self-referrals – referrals from your own websites – showing in Google Analytics. Let’s look at an example of a self-referral and then figure out how to block it.
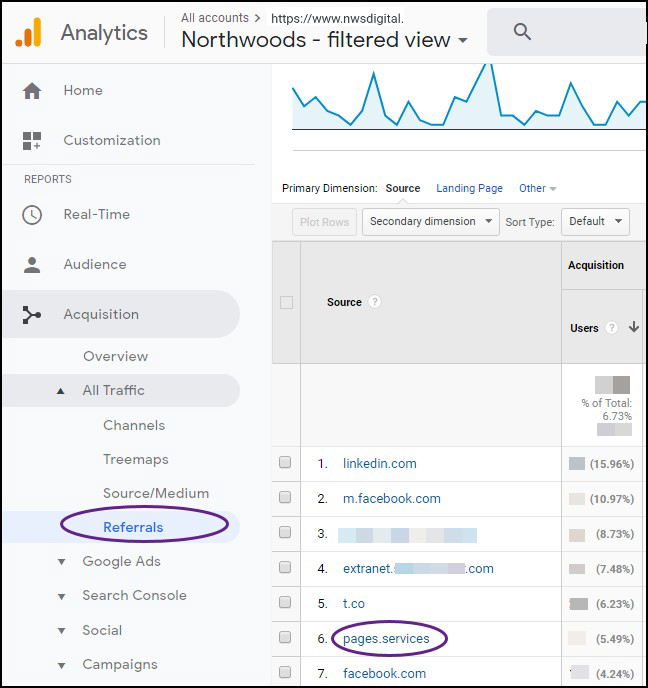
If I look at the Acquisition / All Traffic / Referrals report for Northwoods, I see one referral that shouldn’t be there – pages.services. Those are landing pages created in Sharpspring, our MA (marketing automation) tool. They should not count as independent websites sending traffic to us.
I can block pages.services from being a referral through the Referral Exclusion List. Let’s walk through that.
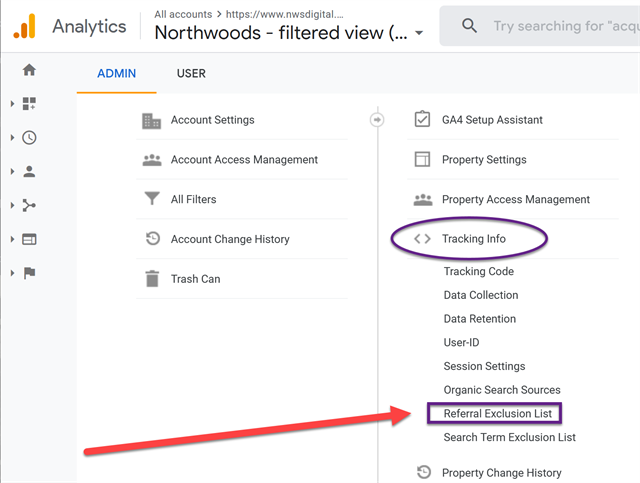
In the GA Admin screen, click on Tracking Info in the Property Column and then on Referral Exclusion List in the list beneath it to bring up the current exclusion list.
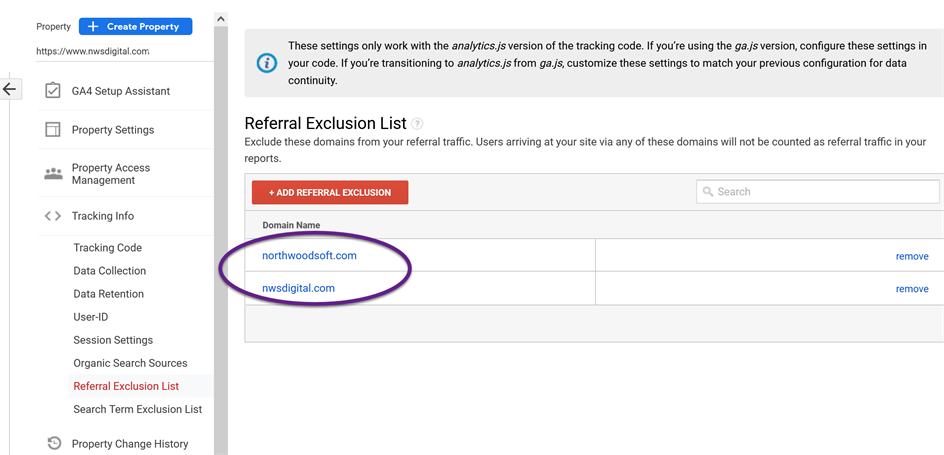
I want to add pages.services to the list. I click on +Add Referral Exclusion, then
- Enter the domain I wish to exclude – pages.services and
- Click Create.
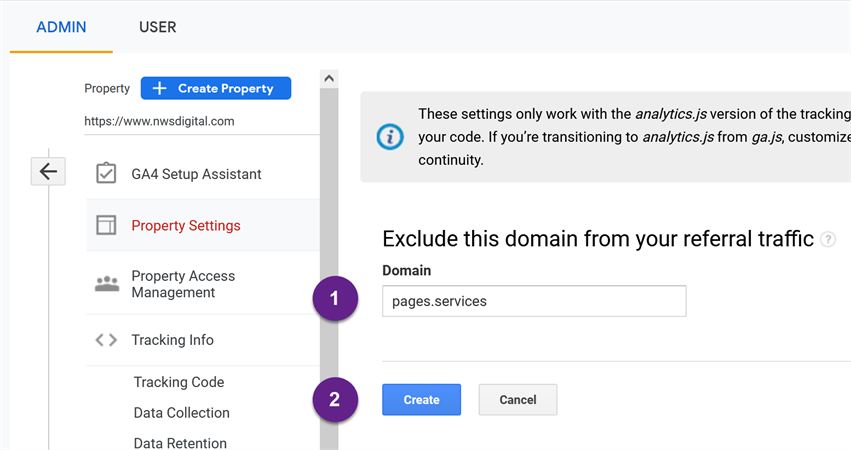
Pages.services is on my excluded list. Sweet!
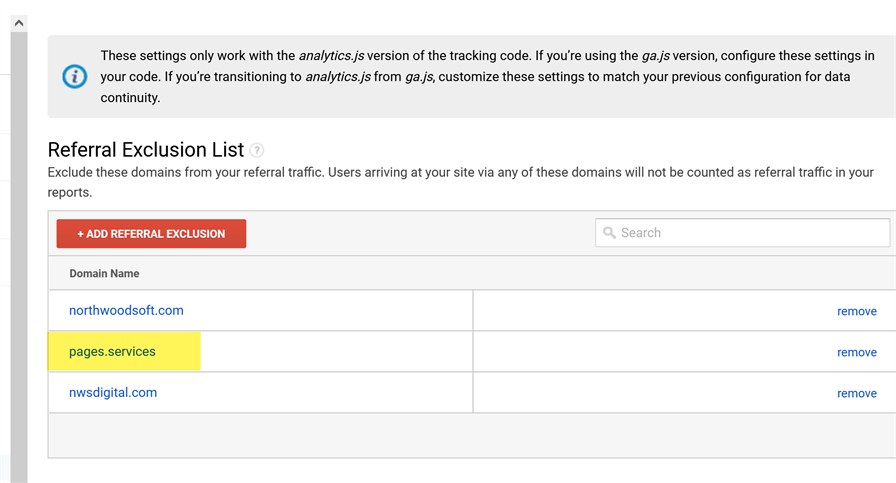
What URLs should you exclude? Your website URL, certainly, as well as any closely-related URLs, e.g., your e-commerce provider or your marketing-automation (MA) sites.
You probably know those URLs. If you don’t, look at the Acquisition / All Traffic / Referrals report. Set the time frame to three months or more and check the list of referrals. If you see any of your own websites’ URLs, add them to the referral exclusion list.
Tip: You need not set up a referral exclusion list for any subdomains; the domains automatically exclude them. For example, we regularly use a subdomain for our PPC ads: try.northwoodsoft.com. We don’t add that subdomain to the exclusion list; the northwoodsoft.com in the URL will automatically exclude it.
As per usual with GA, referral exclusions work from activation forward and not retroactively.
Two asides: First, remember to annotate your referral exclusion, per Tip 6. Second, Google Analytics is not a set-it-and-forget-it tool. Websites, organizations and marketing departments change constantly. You’ll probably have to update Google Analytics changes yearly, if not quarterly, based on new tools, changes in website structure, and many other factors.
Tip 10: Set Up Four Lowercase Filters
Much of the text that GA captures can show up in mixed case. For example, somebody may search for “GA tips” or “ga tips”. Rather than capture that as two separate searches, it’s easier to apply a lowercase filter and capture both of those searches as “ga tips”.
We set up lowercase filters on four GA3 dimensions:
- Search terms
- Source
- Medium
- URI (also called page path – the part of the URL after the .com)
To set up the four lowercase filters, you’ll do the following steps four times.
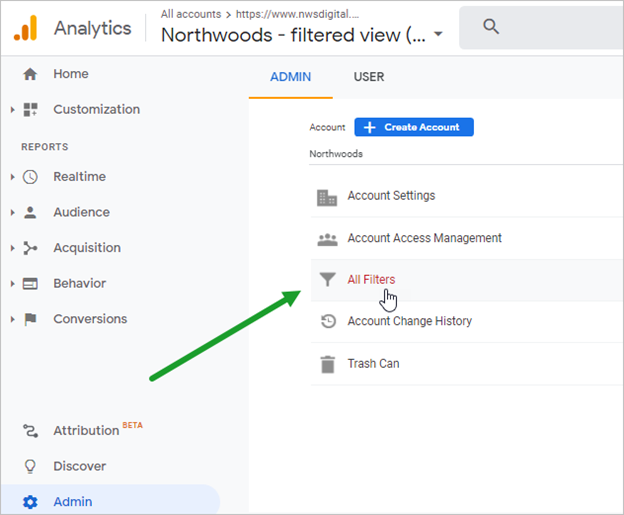
Click on the “All Filters” option in the Account column.
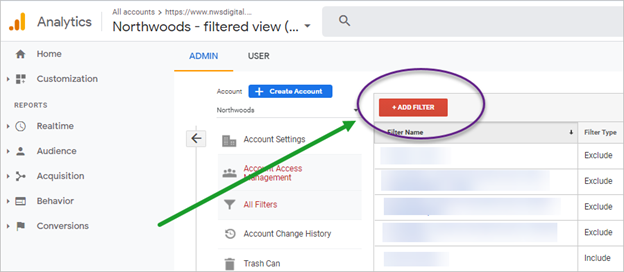
Click on “+Add Filter”.
Give each of the four filters a descriptive name:
- Lowercase URI
- Lowercase source
- Lowercase medium
- Lowercase search term
Choose “Custom” as the Filter Type
Choose “Lowercase”.
Select the relevant field for each of the four filters:
- Request URI
- Search Term
- Campaign Source
- Campaign Medium
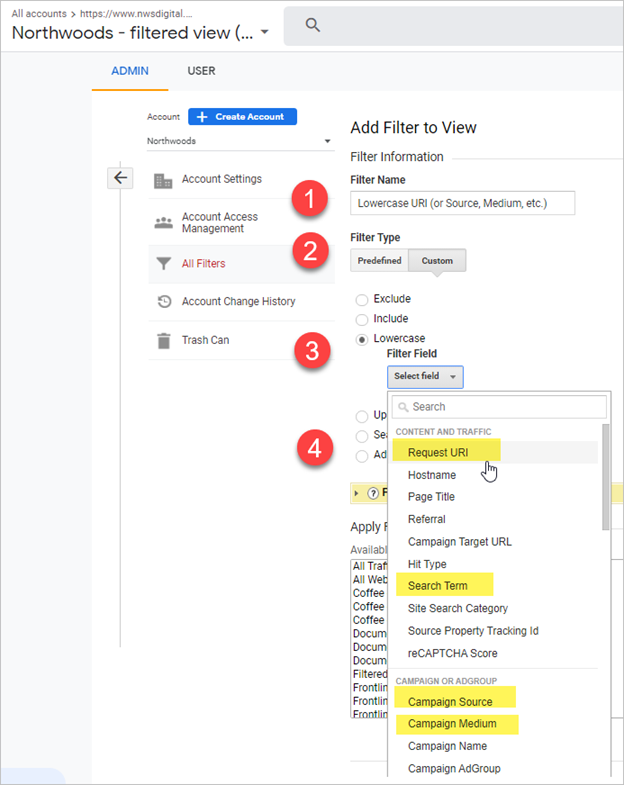
From the list of views on the left, highlight your test view and press ‘Add”. Save your filter.
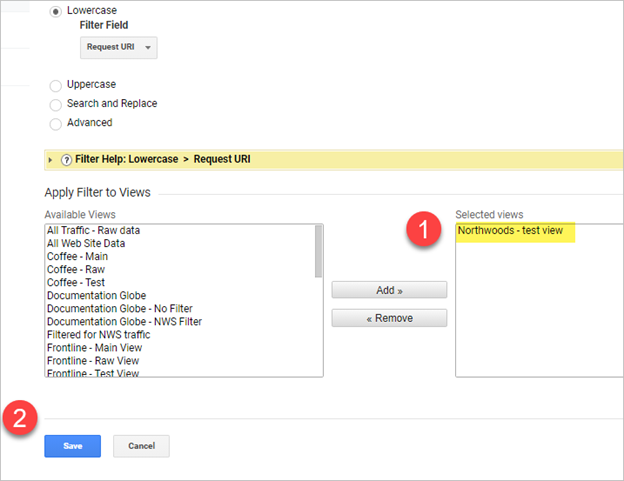
You could apply these filters directly to your main filtered view as well. I prefer to let them run in the test view for a week or so, and then compare the results from the test view to the main or raw view and make sure the filter is working correctly.
For example, in the raw view I may see both “GA4” and “ga4” show up as a search term (in the Behavior > Site Search > Search Terms report). In the test view, I should only see “ga4”.
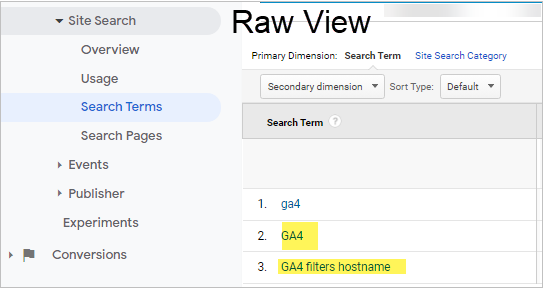
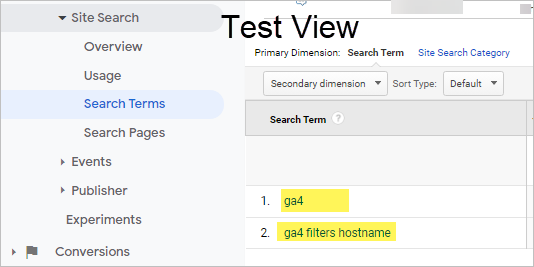
Once you’ve verified the filters are set up correctly, add these four filters to your main view.
As a reminder, do NOT apply these filters to your raw view – the raw view should never have any filters applied to it (Tip 2).
Lifesaver Tip: Test Your Changes via Real-Time
Whenever you do anything significant to your Google Analytics reporting, verify that it’s working by checking Real-Time overview. Check Real-Time when, for example you:
- modify a filter
- publish a new version of the Google Tag Manager (GTM) container
- adjust where the GA or GTM snippet resides on your website
Let’s say you’ve adjusted a filter. You’re sure you did it right. Just to make sure, you go to the Real-Time overview (in your main view, the filtered one) and look at your active users:
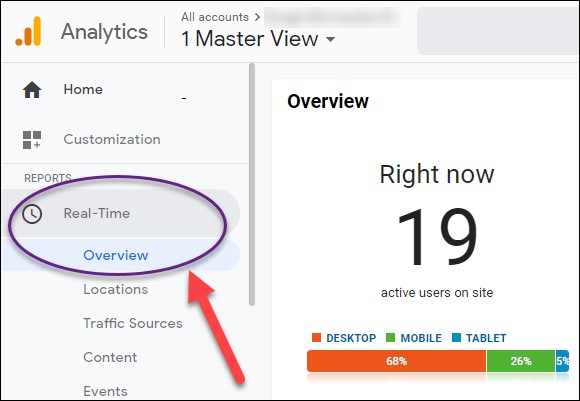
Okay, 19. Watch that number. If the number increases to 20 users, you’re good - traffic is being reported to GA.
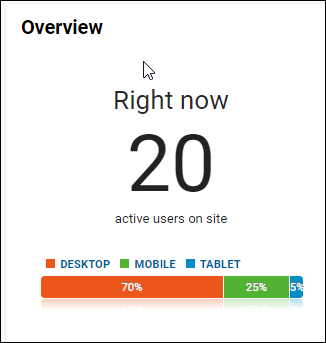
But if that number keeps going down, and never goes up, there’s a good chance you’ve screwed something up. You need an increase. Any increase. It could start at 19 users, drop to five, and then increase to 6. If that’s the case, you’re good.
But if it drops from the 19 to 5 to 3 to 0 and stays there, something’s awry. Reverse your changes and start again.
Summary
I’ve covered the GA3 settings I consider most important – the ones that must be set to make your account strong.
As you go through and apply these changes to your own account, you might notice that reporting screens differ some from my screen shots. Don’t worry. Google frequently changes the appearance of the interface. That will explain some of the differences. Also, I’ve cropped some images in order to focus on the important and relevant parts.
While it may seem like we’ve covered a lot (and we have), we worked through what I consider to be GA Admin 101, with maybe a little 201. Keep in mind that you’re barely into your sophomore year and have much to learn and do beyond what I’ve covered.
But if you make only these 10 changes in your account, it will be set up better than 85 percent of all GA accounts. Congratulations!
Please feel free to reach out to me personally at [email protected].


